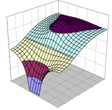
Logo on the right: Power Integrity
The logo on the right is an illustration from my power-integrity
training classes. The Excel surface plot shows the DC
potential distribution on a conductive square plane with a smaller
square-shaped current-consumer in the middle and a short line-type
source along the front left edge. The plane was modeled with a
resistive grid and the simulations were done in Berkeley
SPICE. The grey footprint of the plot represents the plane
shape; the vertical axis shows voltage on linear scale. You
can also recognize a variant of this plot on the front cover of the
book: Frequency-Domain Characterization of Power Distribution
Networks.
